---
blogpost: true
date: Jan 14, 2020
title: Estimating Users
author: Matthew Rocklin
description: Trying hard not to lie
---
People often ask me _"How many people use Dask?"_
As with any non-invasive open source software, the answer to this is
_"I don't know"_.
There are many possible proxies for user counts, like downloads, GitHub stars,
and so on, but most of them are wildly incorrect.
As a project maintainer who tries to find employment for other maintainers,
I'm incentivized to take the highest number I can find,
but that is somewhat dishonest.
That number today is in the form of this likely false statement.
_Dask has 50-100k daily downloads._
This number comes from looking at the Python Package Index (PyPI)
(image from [pypistats.org](https://pypistats.org))
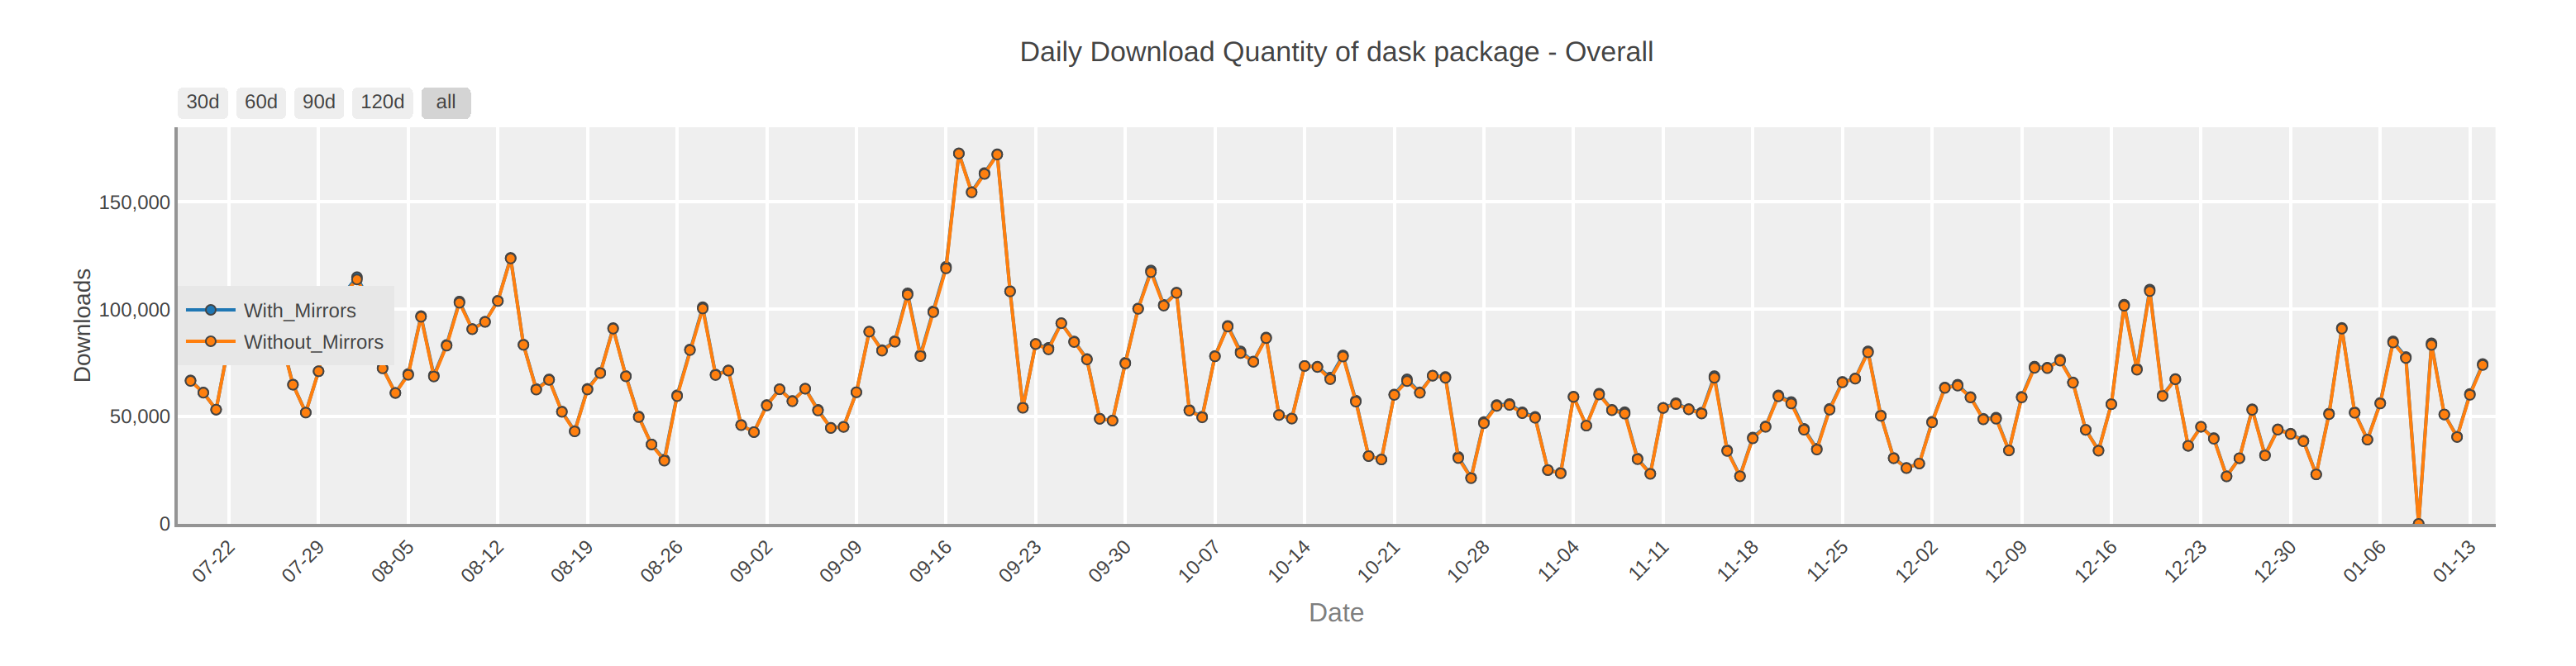 This is a huge number, but is almost certainly misleading.
Common sense tells us that there are not 100k new Dask users every day.
## Bots dominate download counts
If you dive in more deeply to numbers like these you will find that they are
almost entirely due to automated processes. For example, of Dask's 100k new
users, a surprising number of them seem to be running Linux.
This is a huge number, but is almost certainly misleading.
Common sense tells us that there are not 100k new Dask users every day.
## Bots dominate download counts
If you dive in more deeply to numbers like these you will find that they are
almost entirely due to automated processes. For example, of Dask's 100k new
users, a surprising number of them seem to be running Linux.
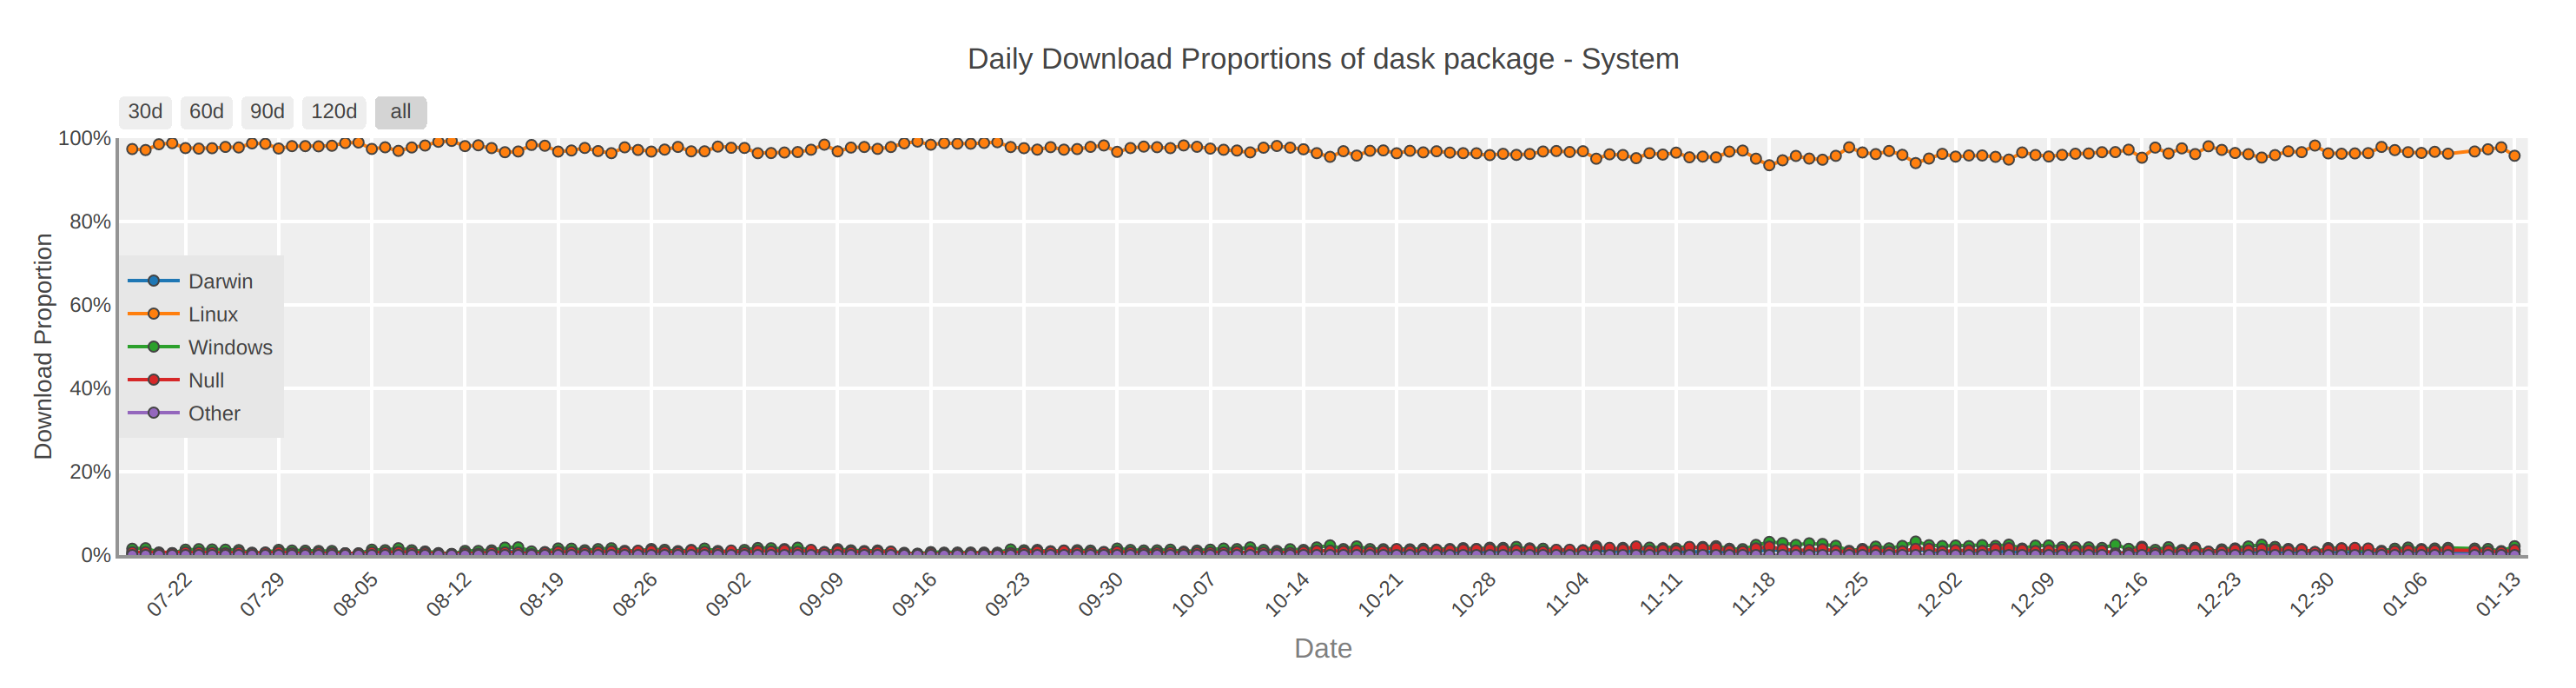 While it's true that Dask is frequently run on Linux because it is a
distributed library, it would be odd to see every machine in that deployment
individually `pip install dask`. It's more likely that these downloads are the
result of automated systems, rather than individual users.
Anecdotally, if you get access to fine grained download data, one finds that a
small set of IPs dominate download counts. These tend to come mostly from
continuous integration services like Travis and Circle, are coming from AWS,
or are coming from a few outliers in the world (sometimes people in China try
to mirror everything)..
## Check Windows
So, in an effort to avoid this effect we start looking at just Windows
downloads.
While it's true that Dask is frequently run on Linux because it is a
distributed library, it would be odd to see every machine in that deployment
individually `pip install dask`. It's more likely that these downloads are the
result of automated systems, rather than individual users.
Anecdotally, if you get access to fine grained download data, one finds that a
small set of IPs dominate download counts. These tend to come mostly from
continuous integration services like Travis and Circle, are coming from AWS,
or are coming from a few outliers in the world (sometimes people in China try
to mirror everything)..
## Check Windows
So, in an effort to avoid this effect we start looking at just Windows
downloads.
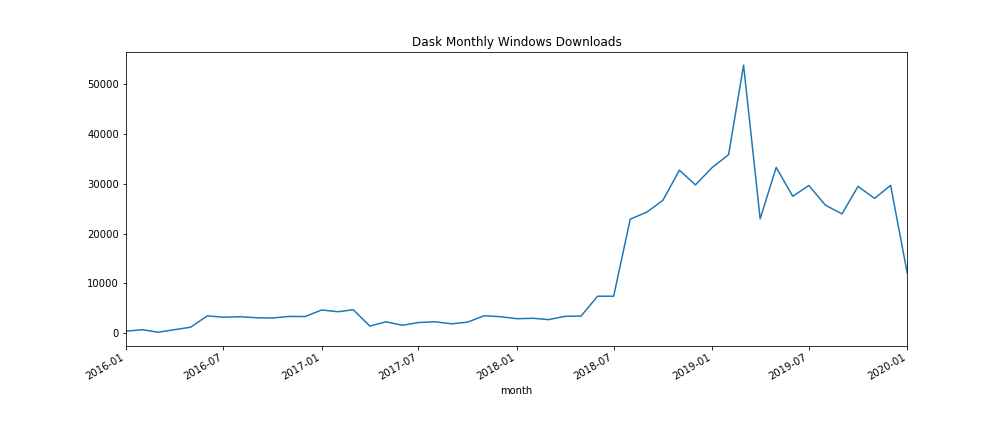 The magnitudes here seem more honest to me. These monthly numbers translate to
about 1000 downloads a day (perhaps multiplied by two or three for OSX and
Linux), which seems more in line with my expectations.
However even this is strange. The structure doesn't match my personal experience.
Why the big change in adoption in 2018?
What is the big spike in 2019?
Anecdotally maintainers did not notice a significant jump in users there.
Instead, we've experienced smooth continuous growth of adoption over time
(this is what most long-term software growth looks like).
It's also odd that there hasn't been continued growth since 2018. Anecdotally
Dask seems to have grown somewhat constantly over the last few years. Phase
transitions like these don't match observed reality (at least in so far as I
personally have observed it).
[_Notebook for plot available here_](https://nbviewer.jupyter.org/gist/mrocklin/ef6f9b6a649a6d78b2221d8fdeea5f2a)
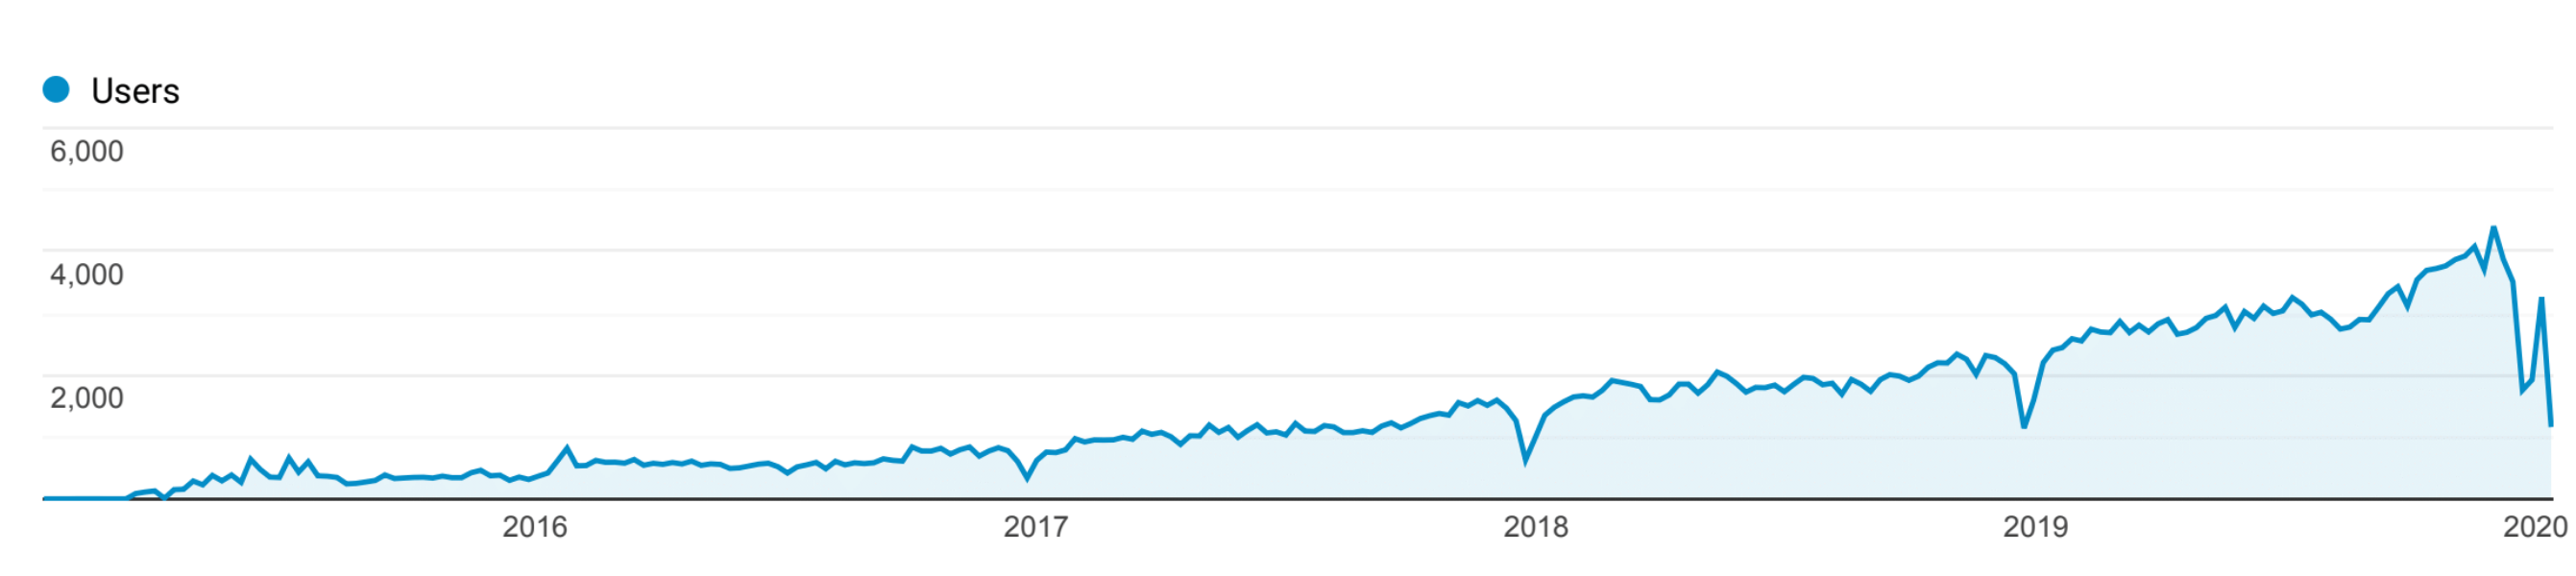
## Documentation views
My favorite metric is looking at weekly unique users to documentation.
This is an over-estimate of users because many people look at the documentation
without using the project. This is also an under-estimate because many users
don't consult our documentation on a weekly basis (oh I wish).
The magnitudes here seem more honest to me. These monthly numbers translate to
about 1000 downloads a day (perhaps multiplied by two or three for OSX and
Linux), which seems more in line with my expectations.
However even this is strange. The structure doesn't match my personal experience.
Why the big change in adoption in 2018?
What is the big spike in 2019?
Anecdotally maintainers did not notice a significant jump in users there.
Instead, we've experienced smooth continuous growth of adoption over time
(this is what most long-term software growth looks like).
It's also odd that there hasn't been continued growth since 2018. Anecdotally
Dask seems to have grown somewhat constantly over the last few years. Phase
transitions like these don't match observed reality (at least in so far as I
personally have observed it).
[_Notebook for plot available here_](https://nbviewer.jupyter.org/gist/mrocklin/ef6f9b6a649a6d78b2221d8fdeea5f2a)
## Documentation views
My favorite metric is looking at weekly unique users to documentation.
This is an over-estimate of users because many people look at the documentation
without using the project. This is also an under-estimate because many users
don't consult our documentation on a weekly basis (oh I wish).
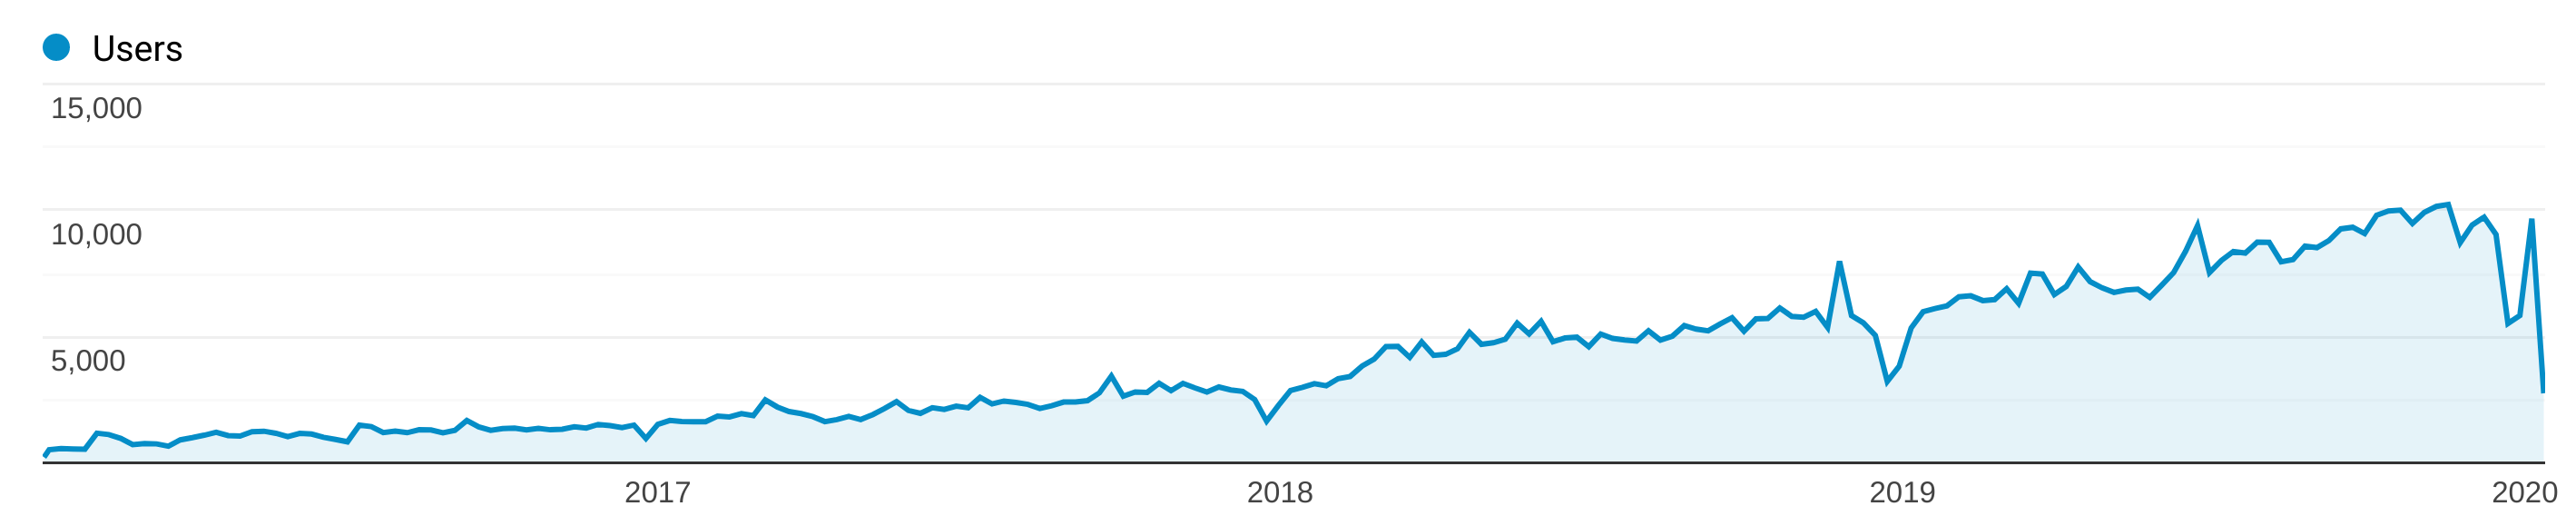 This growth pattern matches my expectations and my experience with maintaining
a project that has steadily gained traction over several years.
_Plot taken from Google Analytics_
## Dependencies
It's also important to look at dependencies of a project. For example many
users in the earth and geo sciences use Dask through another project,
[Xarray](https://xarray.pydata.org). These users are much less likely to touch
Dask directly, but often use Dask as infrastructure underneath the Xarray
library. We should probably add in something like half of Xarray's users as
well.
This growth pattern matches my expectations and my experience with maintaining
a project that has steadily gained traction over several years.
_Plot taken from Google Analytics_
## Dependencies
It's also important to look at dependencies of a project. For example many
users in the earth and geo sciences use Dask through another project,
[Xarray](https://xarray.pydata.org). These users are much less likely to touch
Dask directly, but often use Dask as infrastructure underneath the Xarray
library. We should probably add in something like half of Xarray's users as
well.
 _Plot taken from Google Analytics, supplied by [Joe Hamman](https://joehamman.com/) from Xarray_
## Summary
Dask has somewhere between 100k new users every day (download counts)
or something like 10k users total (weekly unique IPs). The 10k number sounds
more likely to me, maybe bumping up to 15k due to dependencies.
The fact is though that no one really knows.
Judging the use of community maintained OSS is important as we try to value its
impact on society. This is also a fundamentally difficult problem.
I hope that this post helps to highlight how these numbers may be misleading,
and encourages us all to think more deeply about estimating impact.
_Plot taken from Google Analytics, supplied by [Joe Hamman](https://joehamman.com/) from Xarray_
## Summary
Dask has somewhere between 100k new users every day (download counts)
or something like 10k users total (weekly unique IPs). The 10k number sounds
more likely to me, maybe bumping up to 15k due to dependencies.
The fact is though that no one really knows.
Judging the use of community maintained OSS is important as we try to value its
impact on society. This is also a fundamentally difficult problem.
I hope that this post helps to highlight how these numbers may be misleading,
and encourages us all to think more deeply about estimating impact.